
Chemistry only
You may remember an experiment in your science lessons where you passed white light through a glass prism and the white light was split up into a spectrum of colours: red, orange, yellow, green, blue, indigo, and violet. Remember from your physics lessons that red light is long wavelength light with the wavelength getting smaller as you go towards the violet end of the spectrum.

The light emitted from the Sun would produce a spectrum similar to the one above; it would show a continuous band of colours with all the wavelengths of light in the visible spectrum being produced. It is called a continuous spectrum and all the colour are shown below. When sunlight is passed through a prism the light is split up to give the continuous spectrum of colours shown below.

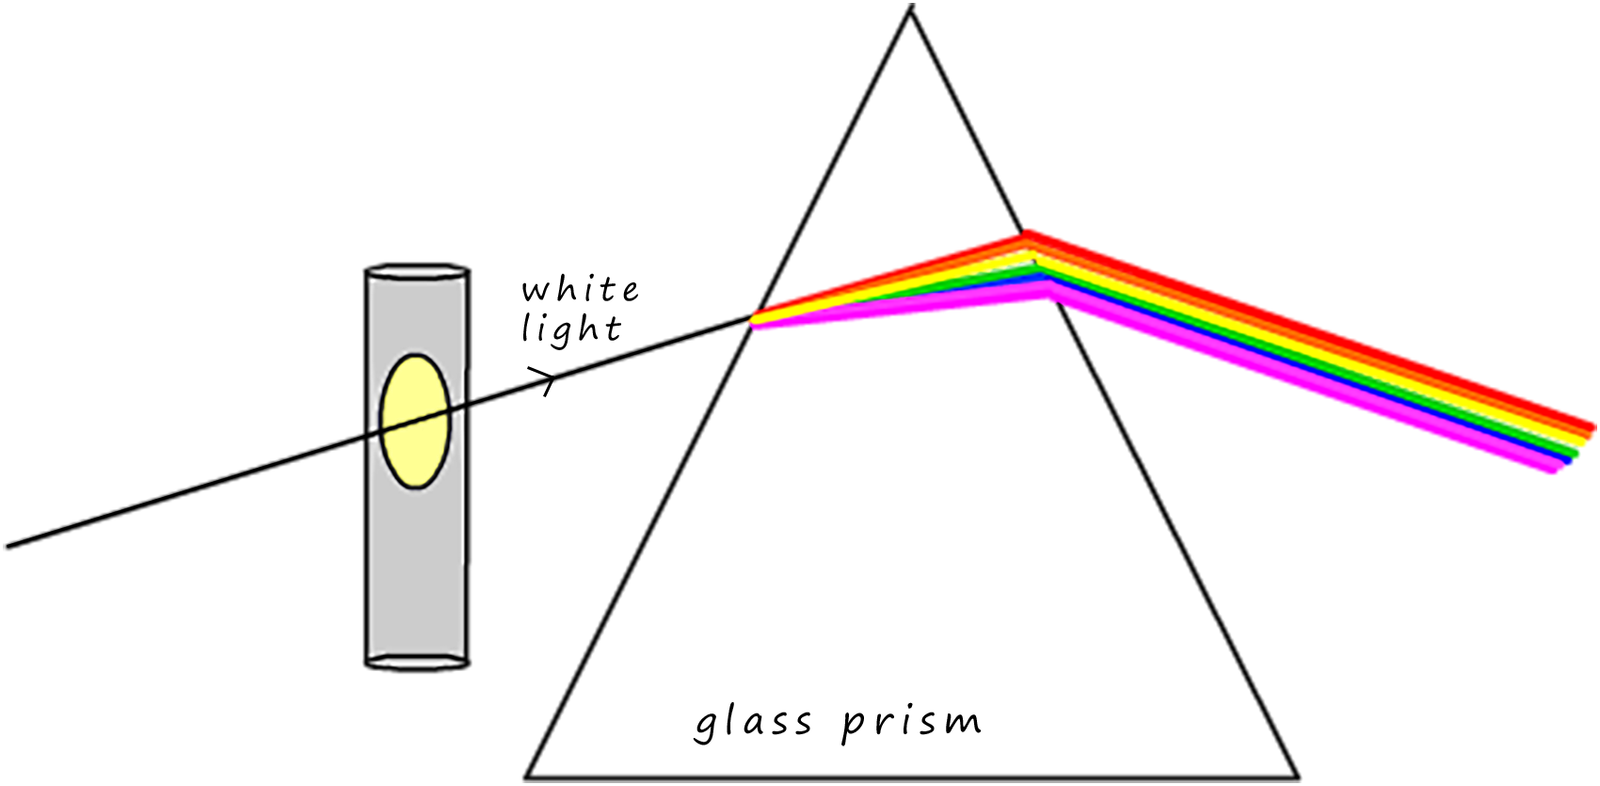
The experiment shown below was set-up at first glance it looks similar to the first image above but this time the white light is shone through a glass window in a lamp containing hot sodium gas before it enters the glass prism.

The spectrum produced this time is shown below and this time it has some dark lines in it, it is called an absorption spectra.

The spectrum produced this time has several very noticeable dark lines in it? What could be causing these dark lines?
Something has taken in or absorbed certain wavelengths of light from the continuous spectrum to leave these dark gaps, but what?
What
has happened is that the electrons in the sodium atoms/ions will absorb certain wavelengths of light from the white light or continuous spectrum of visible light that passes through it and be promoted to
different energy levels within the atom. The black lines in the continuous spectrum above correspond to the wavelengths of light
that have been absorbed by the electrons inside the sodium ions in the lamp.
A spectrometer or spectroscope is an instrument that when light is shone into one end it will produce a line spectrum
at the other. The absorption spectrum above was produced by passing the light as it leaves the lamp through a spectroscope.
If the experiment above is reversed and the light from the hot glowing sodium gas inside the lamp is shone through
a spectroscope then the emission spectrum below is obtained. It has a black background with lots of coloured lines on it. These
lines correspond to wavelengths of light that are emitted
when electrons inside the sodium atom/ion drop from one energy level or shell to another. This is called an emission
spectrum for an element.

This particular emission spectrum is unique for a sodium ion. Other atoms and ions will produce different spectra; the
pattern of lines produced will depend on the electron arrangement within the atom and on the energy levels of the electrons within the atom or ion and on its charge. Since no
two atoms or ions will have identical electron arrangements and electron energy levels within the atom then each element or ion has its own characteristic emission spectrum,
it acts like a fingerprint for the element.
This is the method used by astronomers to determine which elements
are in
stars. By collecting the light from stars and passing them through a spectroscope then it is possible to identify the
elements in the atmospheres of stars. Chemists can also use these emission spectrum to any identify a particular element
present. Since each element has its own unique emission spectrum all that is needed is to compare the spectrum obtained from an unknown sample with those in a data bank. There is the added advantage that the intensity of the line (whether it is
bright or faded) will indicate the concentration or amount of the particular element present. This is simply a case of matching up the
lines in the spectrum, a very tedious and repetitive task that computers are well designed to carry out!
Flame emission spectroscopy is an instrumental method used to identify metal ions present in solutions. A sample of the metal ion is placed in a hot flame; this will excite the electrons in the metal ions to higher energy levels. Once the electrons lose energy they will fall back down to their original energy level inside the ion they will emit light at very particular wavelengths, this light is then passed through a spectrometer and an emission spectrum will be produced. This technique is very sensitive and can detect trace amounts of any particular ion. It is also quick and easy to do and will produce reliable and accurate results. The only problem is that the sample may contain lots of different metal ions, so the emission spectrum will contain a mix of lots of emission lines for each of the metal ions present. Luckily most ions have very characteristic parts to their emission spectrum that with a bit of practice makes it easy to identify particular ions e.g. in the sodium emission spectrum you will see 2 very bright yellow lines at wavelength 588nm and 589nm (see image above); these lines are like a big glowing sign- they are very distinctive of sodium ions-you could also use a computer to do the analysis the sample for you!