

When a molecule goes through the ionisation step in a mass spectrometer it can form various types of ions depending on the ionisation method used. One of most common method of ionisation that we have previously looked at is electron impact ionisation (IE). Here a stream of high energy electrons is emitted from an electron gun which collides with and then remove an electron from the sample molecule to form a positively charged ion called the molecular ion or the parent ion, this ion should be the one with the highest m/z ratio. The molecular ion or parent ion is given the symbol M+ or more accurately M+.
Most stable organic molecules contain an even number of electrons, since it requires the sharing of two electrons to form a covalent bond. When molecules are ionised in the mass spectrometer they lose an electron and so end up with an odd number of electrons, which obviously means that somewhere in the molecule is an unpaired electron.
Now recall that free radicals are very reactive species containing an unpaired electron and when the sample molecules in the mass spectrometer are ionised by the fast moving electrons from the electron gun, which will knock out either an electron in a covalent bond or an electron in a lone pair to leave behind a positively charged ion which is also a free radical since it has an unpaired electron. So the molecular ion formed will always be a radical cation. The ions or if you prefer radical cations which form in the mass spectrometer are unstable and will generally break up or fragment to form smaller cations and free radicals for example the molecular ion shown below may fragment to form a smaller cation (a positively charged ion) and a free radical:
In this equation the unstable molecular ion (M+.) fragments to form a positive ion (a cation) and a free radical. Now recall that the next step after ionisation in a mass spectrometer is the acceleration step, which happens as a result of the attraction of a positively charged ion to the negatively charged acceleration plates, this means that the free radicals produced will NOT be accelerated and so will not reach the detector in the mass spectrometer.
One of the most valuable pieces of information obtained from the mass spectrometer is the
relative atomic mass (Ar) or relative molecular masses (Mr) of the unknown sample. Obtaining this
information is a step forward in identifying the unknown substance that you are analysing.
So what does a mass spectrum produced by a mass spectrometer look like? Well the mass spectrum is simply a graph of relative abundance against mass to
charge (m/z) ratio. The peak produced at the maximum m/z ratio will likely indicate the relative atomic mass (Ar) or relative molecular mass (Mr) of the sample under analysis. However large complicated or branched molecules are highly likely to break up or fragment into smaller parts in the mass spectrometer; in this case if none of the parent molecules survive intact then the peak at the highest m/z ratio is unlikely to be that of the molecule under analysis.
The height of the peaks found in a mass spectrum are referenced to the most abundant ion detected in the mass spectrometer which is assigned an abundance of 100 units, this ion is often referred to as the base peak and the intensities of all the other ions detected are measure relative to this base peak. Now most of the ions shown on the mass spectrum of any particular substance will have a single positive charge so this means that the mass to charge ratio (m/z) can be considered as the actual mass of that particular ion. The other detected ions are formed as a consequence of the molecular ion fragmenting or other ions fragmenting into smaller ions and free radicals. It should be noted for most organic compounds the C-C and C-H bonds break freely and even for fairly simple molecules many peaks may be produced in the mass spectrum. It is also worth noting that it may prove very difficult if not impossible and indeed not necessary to try and identify all the ions responsible for many of the peaks found in a mass spectrum, however there are some common tell tale peak that are found in the mass spectrum of many organic molecules and the presence of these peaks can aid in identify an unknown substance.

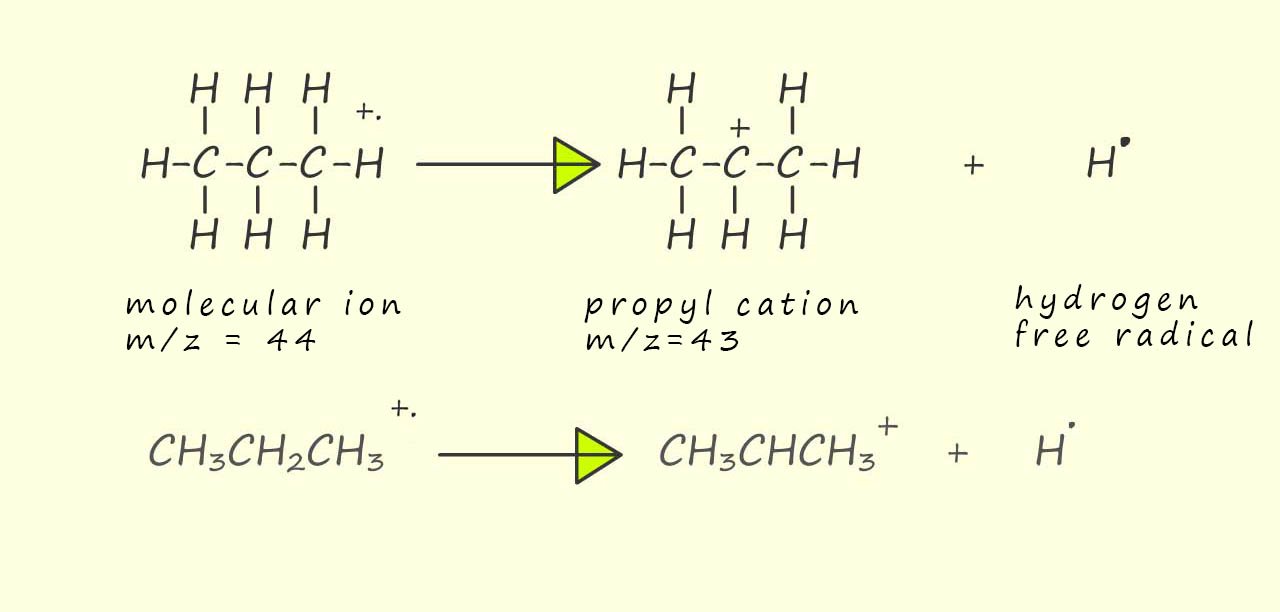
As an example let's start by looking at the mass spectrum for the hydrocarbon molecule propane (CH3CH2CH3), now propane will have a relative molecular mass (Mr) of 44. The molecular ion (M+.) of propane will therefore have a mass to charge ratio (m/z) of 44. I have identified 5 peaks in the mass spectrum of propane as shown opposite. Now as I mentioned above it can prove very difficult to identify the ions responsible for all the peaks in the mass spectrum and quite often it is unnecessary to do this. However let's look at the reasoning on how to identify the 5 highlighted peaks in the mass spectrum of propane.
Now it is just a case of trying some simple arithmetic to work out the structures of ions with the required mass to charge ratio (m/z). The loss of a methyl (CH3.), ethyl (CH3CH2.) and hydrogen (H.) free radical is a common occurrence in the mass spectrum of organic molecules. For example the peak in the mass spectrum at m/z=44 is due to the parent molecular ion (CH3CH2CH3+.) while the peak at m/z=43 is only one mass unit away from that of the molecular ion. The only option available to lose one unit of mass is the loss of a hydrogen free radical as shown leave a propyl cation:
The base peak, that is the peak due to the most abundant ion detected is not due to the presence of the molecular ion (m/z= 44) but is due to an ion with a mass/charge ratio of 29 units. So as above we can use some simple arithmetic try to work out the mass of an ion that has a mass of 29 units. Well the molecular ion has a mass of 44 units and 44-29=15, so the molecular ion is likely losing a neutral molecule or free radical with a mass of 15 units, this is probably a methyl group (-CH3) or in this case a methyl radical (CH3.). This will leave a CH3CH2+ or ethyl ion with a mass to charge ration (m/z) of 29, this is outlined below:
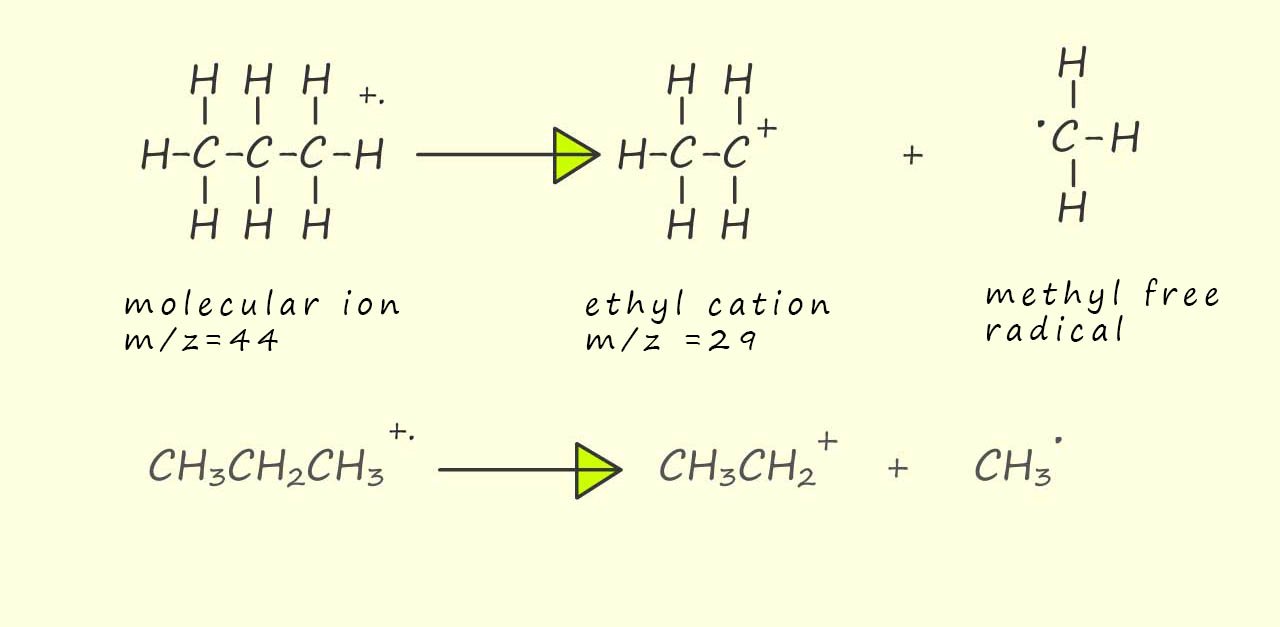
To form the ethyl cation above a C-C bond was broken in the molecular ion, however if one of the other C-C bonds was broken instead it could result in the formation of a methyl cation and an ethyl free radical. The methyl cation would then give the peak at m/z=15 in the mass spectrum. This is outlined below:

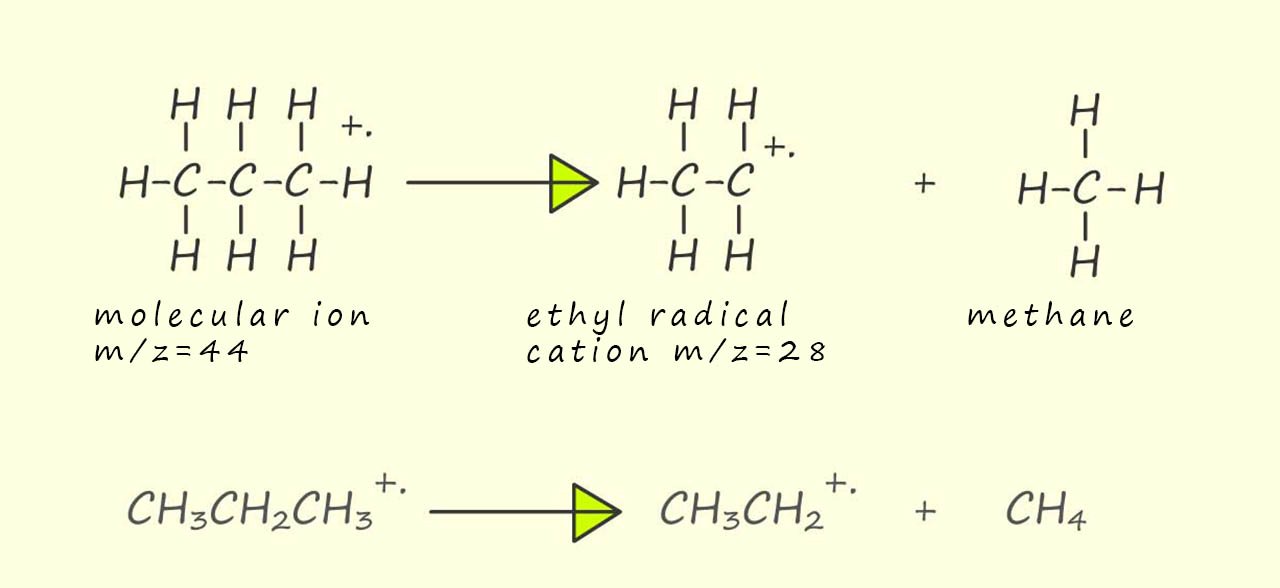
So far we have used some simple arithmetic and a bit of simple guess work to suggest the identity of possible ions which may be responsible for some of the peaks in the mass spectrum of propane. In the two examples above the molecular ion (a radical cation) has fragmented to form a cation and a free radical. However another common fragmentation which can occur and maybe responsible for the peak at m/z 28 is the fragmentation of the molecular ion to form a radical cation and a neutral molecule. Now 44-28=16, so to produce the peak at m/z=28 the molecular ion needs to lose 16 units of mass. Now methane (CH4) has a Mr of 16 so removing a neutral methane molecule from the molecular ion would leave an ethyl radical cation with a m/z=28, this is outlined below:
Recall that isotopes are atoms with the same atomic number (proton number) but different mass numbers due to the fact that they have extra neutrons in their nuclei. Organic molecules obviously contain the element carbon and you will often find in the mass spectra of organic compounds a small peak at M+1 due to the presence of the 13C isotope in the molecule. If the organic molecules also contain oxygen and nitrogen atoms then you may also see peaks with masses above that of the molecular ion due to the presence of heavy isotopes of these elements such as 18O and 15N.
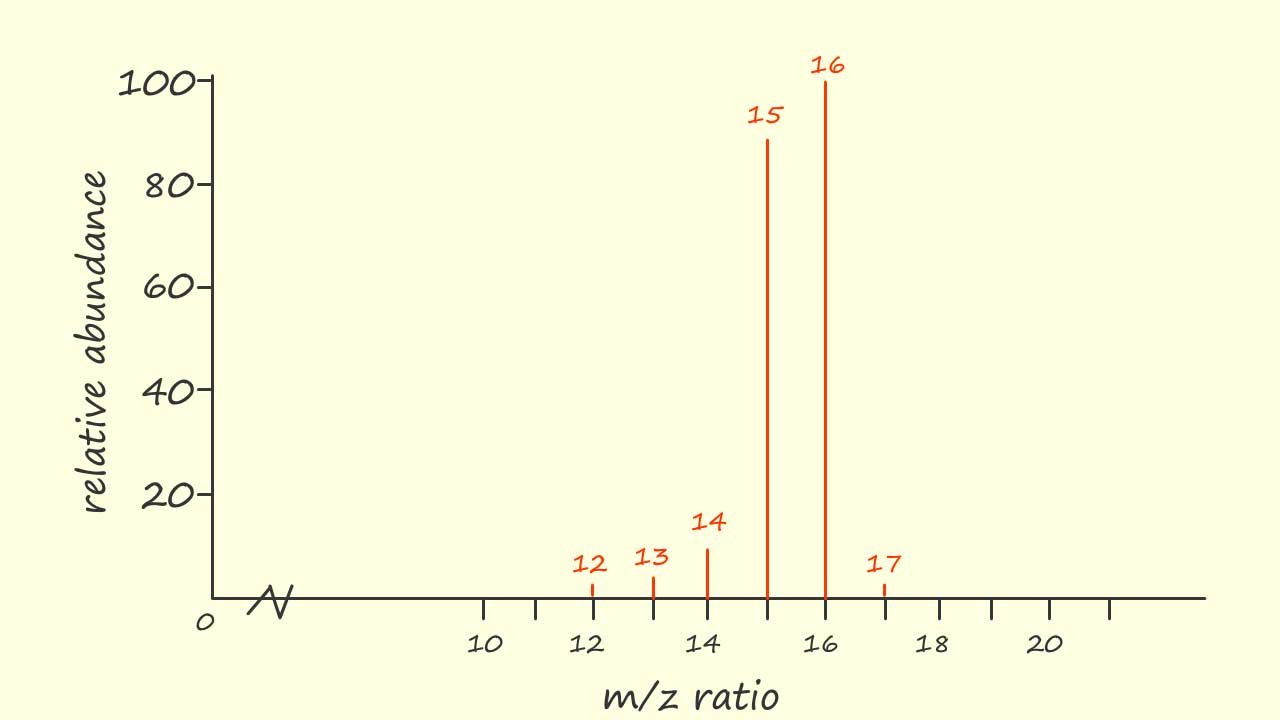
The mass spectrum of the simple hydrocarbon molecule methane (CH4) is shown opposite. Now methane has a relative molecular mass (Mr) of 16 and the base peak in the mass spectrum shown at m/z=16 is due to the molecular ion CH4+.. Now you may notice a small peak with a m/z=17, this is the M+1 peak due to the presence of the 13C isotope and the radical cation responsible for this peak is 13CH4+.
The peak at m/z=15 is due to the loss of a hydrogen free radical from the parent molecular ion to form a methyl cation (CH3+) while the peak at m/z=14 is due to the loss of a neutral hydrogen molecule from the parent molecular ion to form a methylene radical cation, this is outlined below:
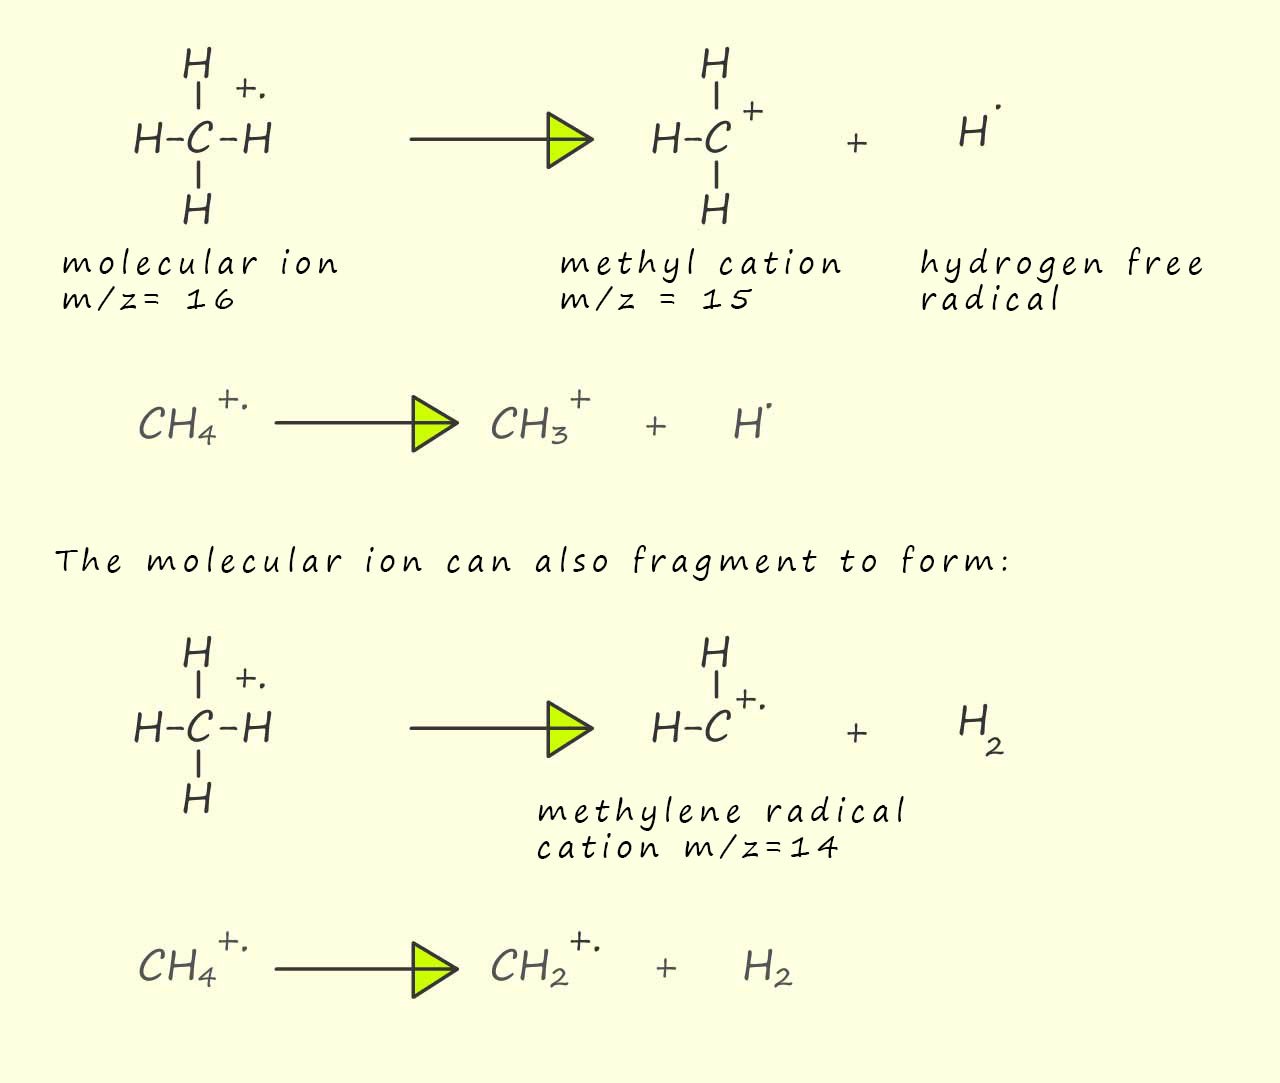
Now the methyl cation and the methylene radical cation are both unstable and can undergo further fragmentation to form ions with m/z ratios of 12 and 13, this is outlined below:
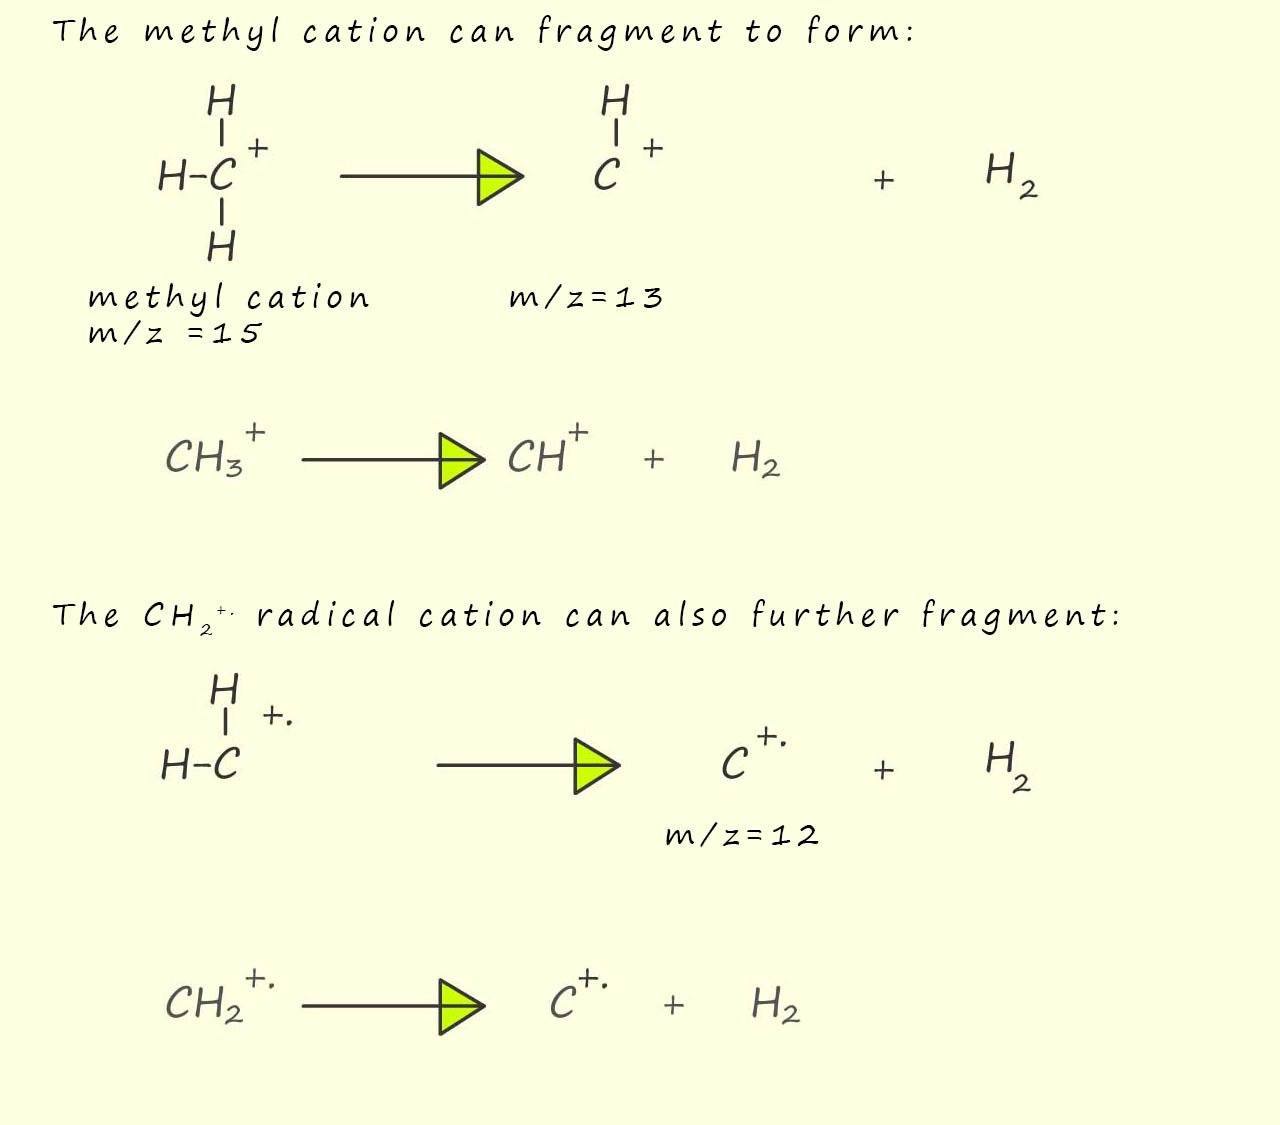
Now you maybe wondering how to you decide what particular ion is formed and what free radical is lost during any particular fragmentation that may occur, my advice is simply try and work out the structure of an ion or radical cation with the required mass, start with possible structure produced from the fragmentation of the molecular ion and then start trying to work out structures from the fragmentation smaller fragments. In mass spectroscopy generally all possible fragmentations can occur though dominant peaks are likely to have been produced through fragmentation patterns that involve stable ions; that is ions best able to support a positive charge.
We mentioned that the M+1 peak appears is the mass spectrum of all organic compounds and is due to the presence of the 13C isotope in the organic molecules. The M+1 peak can also be useful in helping to work out the number of carbon atoms present in a molecule. Simply measure the relative heights of the peaks for the molecular ion (M+) and the M+1 ion and the use the formula below to calculate the number of carbon atoms in the molecule.

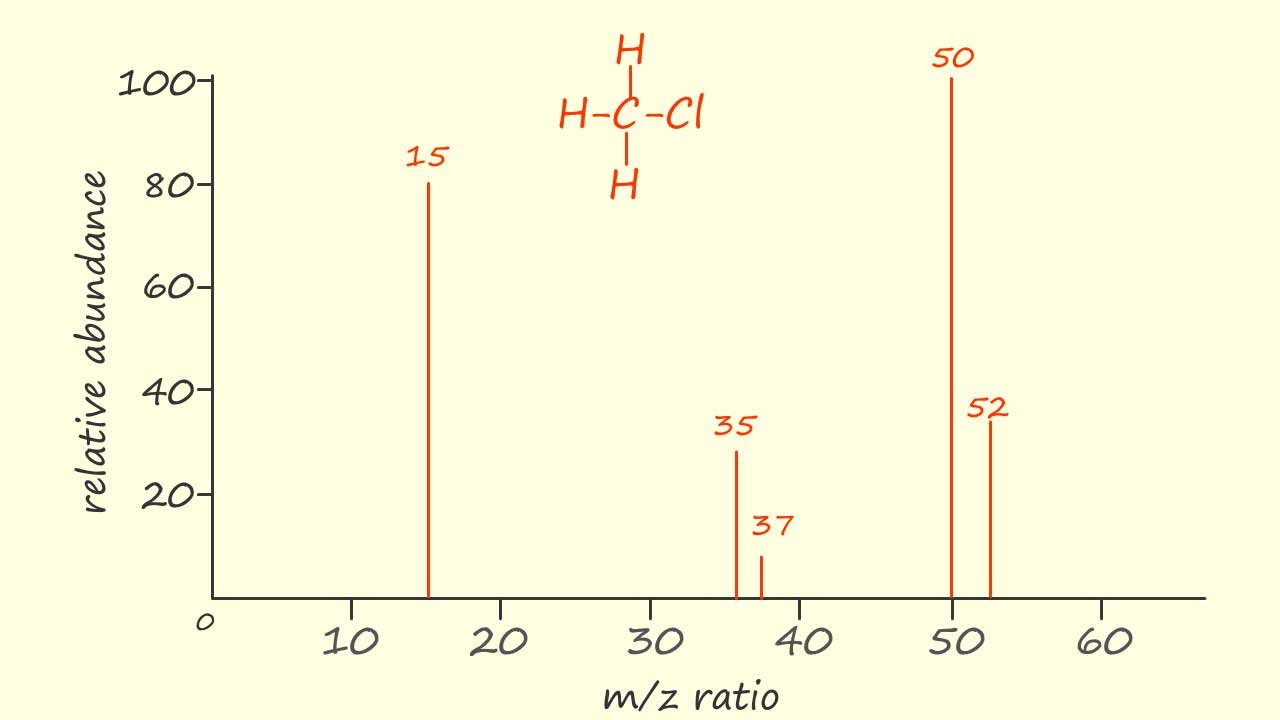
The mass spectra of many molecules can also show the presence of isotopes of an element, for example the element chlorine has two common isotopes 35Cl and 37Cl with relative abundances of 75% and 25%, that is a 3:1 ratio in favour of the 35Cl isotope. A simplified mass spectrum of chloromethane (CH3Cl) is shown opposite. Now CH335Cl has a Mr of 50 and from the mass spectrum shown its cation will form the base peak with an intensity of 100%, the radical cation containing the 37Cl isotope (CH337Cl+.) of chlorine will be responsible for the peak at m/z=52. It should be noted that the ratio of the peaks at m/z 50 and 52 are in the ratio of 3:1, exactly the same as found with the two isotopes of chlorine. Similarly the peaks at m/z 35 and 37 are due to the presence of the 35Cl+ and 37Cl+ ions with the height of these two peaks also in the ratio of 3:1. The peak at m/z 15 will be due to the presence of the methyl cation (CH3+).
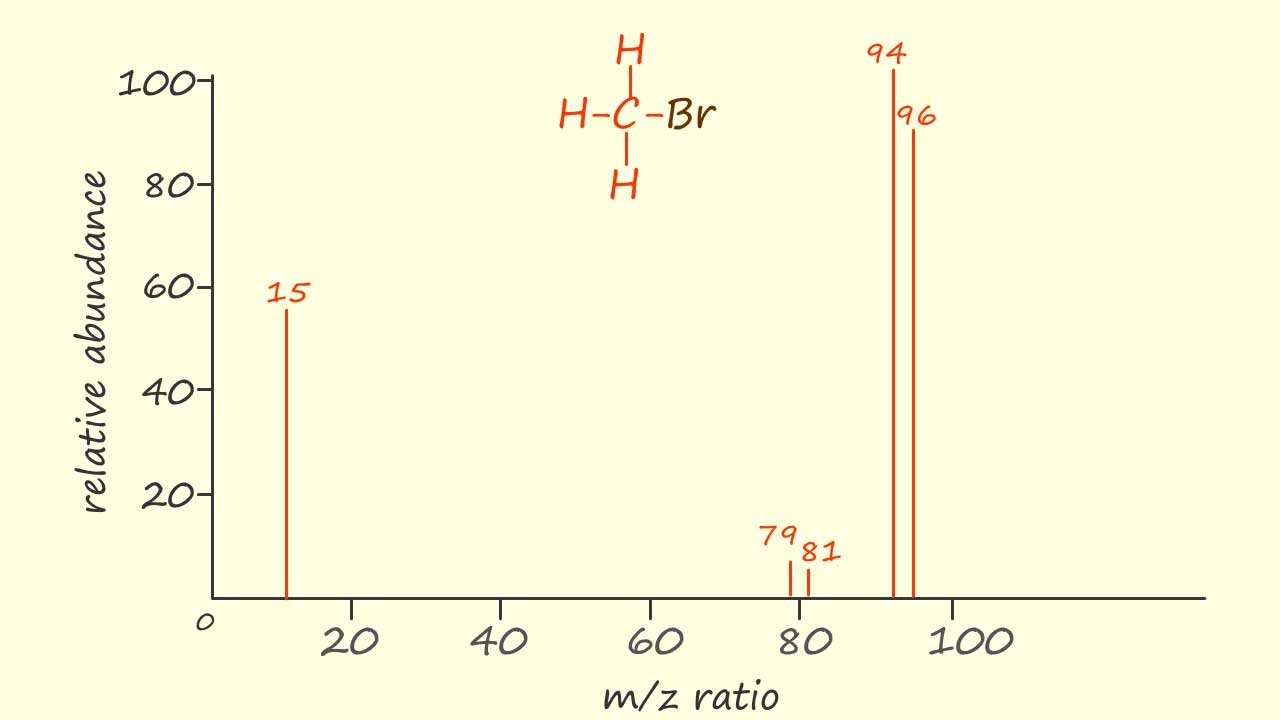
Bromine has two isotopes 79Br and 81Br with relative abundances of 50.5% and 49.5%. Now since these two isotopes are present in almost equal amounts it makes it fairly easy to identify the presence of bromine in an organic compound from its mass spectrum, for example a simplified mass spectrum of bromomethane is shown opposite.
Now the Mr of CH379Br is 94 and we can clearly see that the cation for this particular molecule of bromomethane is shown with an intensity of 100% in the mass spectrum, but the CH381Br+ cation is also clearly visible at m/z=96. The two peaks at m/z ratios of 79 and 81 are obviously due to the presence of the CH379Br+ and the CH381Br+ ions while the peak at m/z=15 is due to the presence of a methyl cation (CH3+).
The presence of the "twin peaks" two mass units apart at m/z values of 79 and 81 are a clear sign that the molecule contains bromine isotopes.
The electron impact ionisation of a sample in the mass spectrometer as we have said results in electron loss from a molecule and the formation of a free radical cation, that is a positively charged cation containing an unpaired electron:
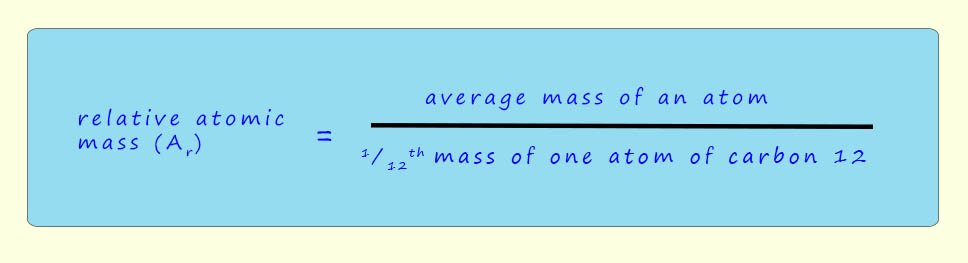
The actual masses of atoms are very small, they are typically in the range of 10-24g to 10-22g. So instead of using these very small numbers we use relative atomic masses instead. Now the word relative here means compared to. Scientists use a mass scale based on an atom of the isotope carbon-12 isotope (12C) which has a mass of exactly 12 amu or u. So an atomic mass unit (amu), denoted by amu or u, is defined as exactly 1/12th the mass of a carbon-12 (¹²C) atom.
The isotope of carbon-12 was chosen as the reference point because it's the most abundant stable isotope of carbon found in nature. This standardized unit allows scientists to compare the relative masses of atoms easily. So the masses of atoms are worked out by comparing them to an atom of carbon-12, this mass is called the relative atomic mass and it is given the symbol Ar:
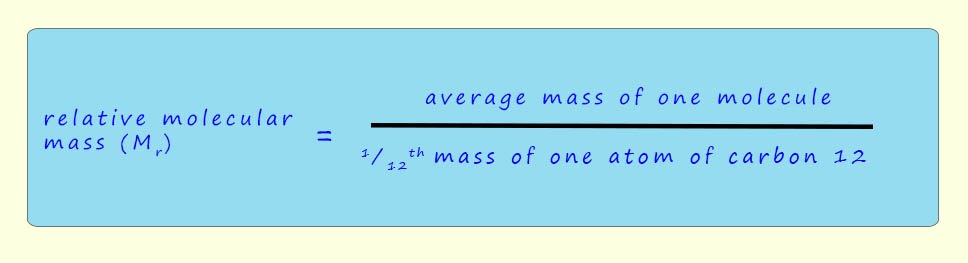
In a similar way the masses of molecules also uses the relative atomic mass scale using the carbon-12 isotope as the standard. The relative molecular mass (Mr) is defined as:

The relative atomic mass of an element which is recorded in the periodic table is an average mass of the element taking into account the presence of any isotopes, for example the mass spectrum for the element boron is shown opposite:
There are two peaks present in the mass spectrum of boron indicating the presence of 2 isotopes. Assuming the boron ions in the mass spectrometer had a charge of +1 the m/z ratio will simply be the mass of each isotope, in this case
the masses will be 10 and 11. The percentage abundances of each isotope is also shown above each peak in the mass spectrum. Now we can see that one isotope is much more common than the other, the isotopes are present almost in the ratio of 4:1.
To calculate the relative atomic mass of boron we can use the data obtained from the mass spectrum and substitute the values into the formula below ( note: the Greek letter sigma (Σ) in the equation simply means to sum all the terms:
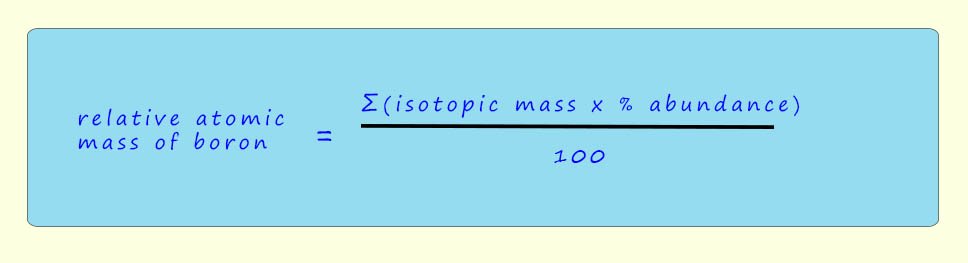
So using the figures from the mass spectrum we have:
