Higher and foundation tiers
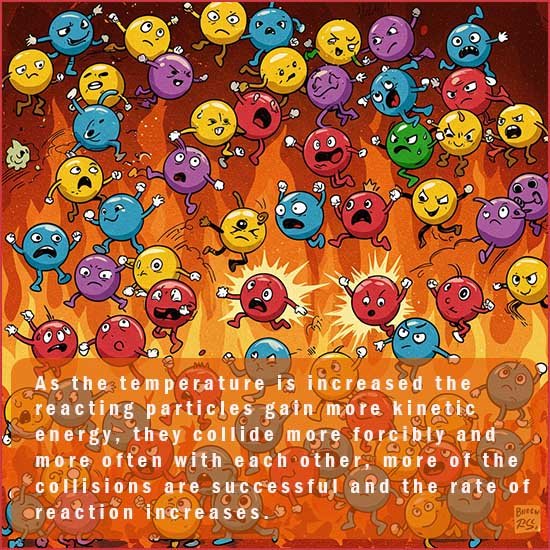
When the temperature of the reactant particles is raised they gain kinetic energy; this will allow the particles to move faster and collide more often with each other. Not only do the particles collide more frequently but more of the collisions will be successful, that is lead to the formation of products. The more successful collisions there are the faster will be the rate of reaction. Temperature has a large effect on reaction rates.
As a rough rule of thumb if you raise the temperature of the reactants by 100C then the rate of reaction doubles. As the temperature increases a larger proportion of the particles will have energies above the activation energy; this means they will be able to collide successfully and ultimately form the products quicker.
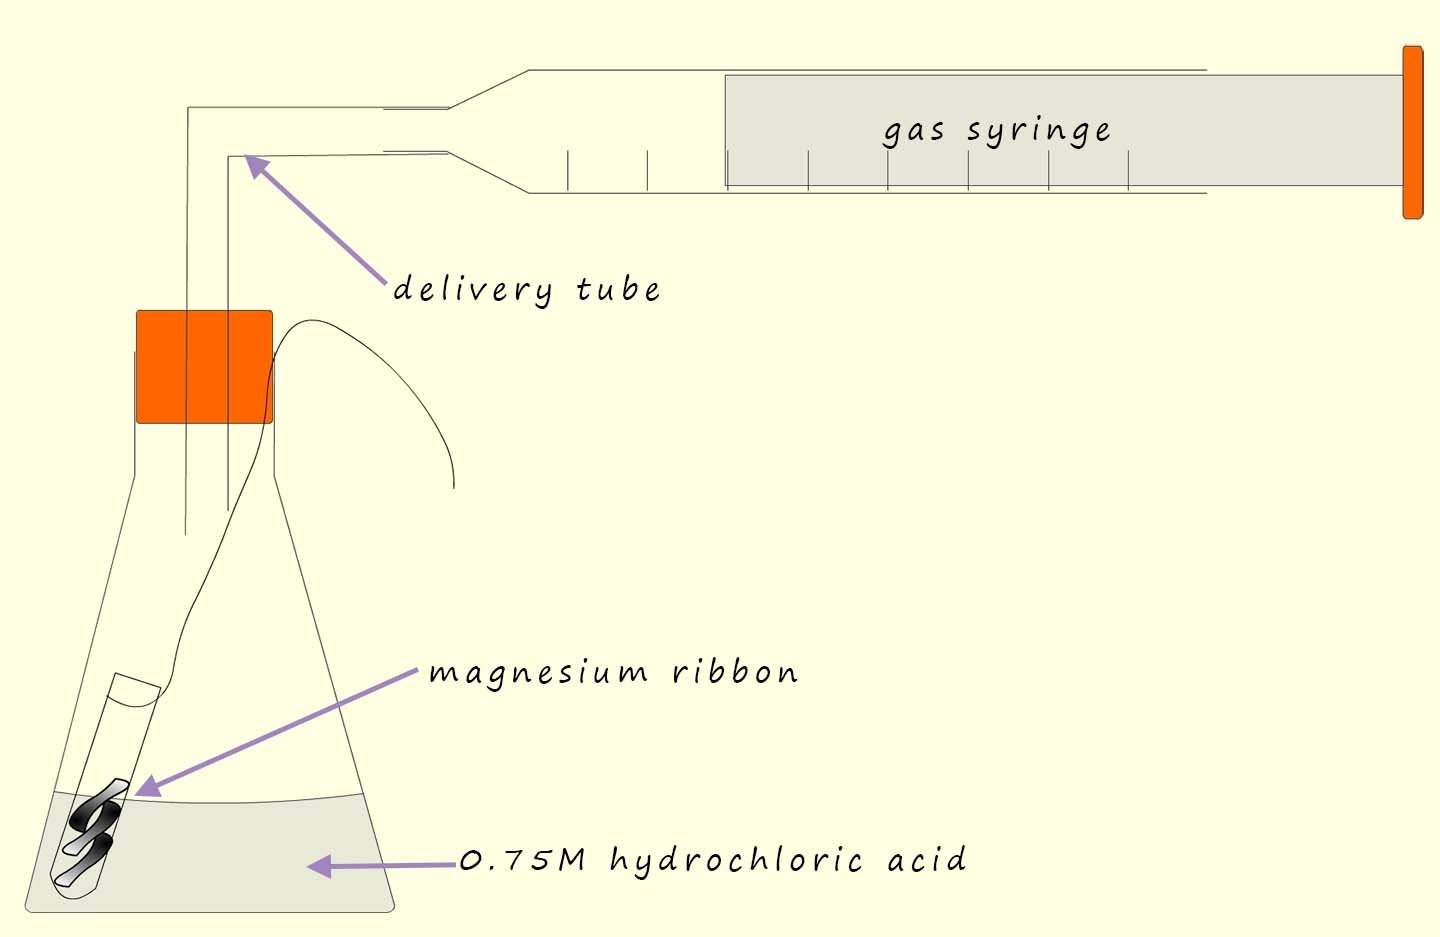
Magnesium ribbon reacts with hydrochloric acid according to the equation below:
How could you carry out an experiment to investigate how temperature affects the rate of this reaction? Well firstly as in any rate of reaction experiment you need to decide what exactly you are going to measure. Is this case there are two obvious choices for the dependent variable; these are:
Or
The independent variable; that is the variable in an experiment that you decide to change; in this case the independent variable will be the temperature of the acid. To try and identify a pattern or trend in any results obtained you will need at least 5 different values for the independent variable; so simply pick 5 different temperatures at which you plan to carry out the experiment. Ensure that at the temperatures you decide to use will not be so fast that it wil be difficult to time accurately and also not so slow that you are waiting hours for the reaction to finish.
You could time how long it takes to collect say 40ml of hydrogen gas using at least five different temperatures for the acid|. Make sure the acid is in excess; that is use much more than you need; this will ensure that all the magnesium ribbon reacts. Possible temperatures to use and a results table to record your results are shown below:
| temperature of acid/0C | 30 | 35 | 40 | 45 | 50 | 55 |
|---|---|---|---|---|---|---|
| time to collect 40ml of hydrogen gas/s |
The experiment should be repeated at least twice for each temperature to ensure your results are reliable and to also help spot any anomalous results, that is any results which do not fit the observed pattern or trend.
To ensure the investigation is fair there are number of variables that must be controlled. The volume and concentration of acid used should not be changed from one experiment to the next as both of these variables will have an effect on the rate. Similarly the mass or amount of the magnesium ribbon used should remain the same across all experiments. The surface area of the magnesium should also be the same for all the temperature experiments that you plan to carry out. Controlling all these variables will ensure that only the independent variable; that is the temperature of the acid will the only variable affecting the rate of the reaction.
 The graph opposite has been drawn from a set of results collected by a student while carrying out an experiment similar to the one above. This experiment also released a gas and the student
repeated the experiment at low, medium and high temperatures. From the graph you can see that the red line
for the high temperature
reaction has the steepest gradient or slope showing that the largest volume of gas was released in the shortest time- that is the rate
was the fastest for this high temperature reaction.
The student had no anomalous results since all the points plotted on the graph are close to the lines of best fit.
The graph opposite has been drawn from a set of results collected by a student while carrying out an experiment similar to the one above. This experiment also released a gas and the student
repeated the experiment at low, medium and high temperatures. From the graph you can see that the red line
for the high temperature
reaction has the steepest gradient or slope showing that the largest volume of gas was released in the shortest time- that is the rate
was the fastest for this high temperature reaction.
The student had no anomalous results since all the points plotted on the graph are close to the lines of best fit.
The low temperature reaction is shown by the blue curve. You can clearly see that this curve has the shallowest gradient or slope showing that the reaction was the slowest. The yellow line for medium temperature is located between the high and low temperature curves showing that the rate of this reaction is somewhere between the high and low temperature rates.